Doug Blanks Hindman and Michael Beam
The ubiquity of national-level outlets creates the illusion of an abundance of news even as the number of local outlets declines. This study is a report of state and national surveys assessing local news by rural and non-rural residents of Washington state. The findings point to a lack of locally relevant content, not a lack of skills or interest among rural Washingtonians. Implications for rural Washington state citizens’ political knowledge and civic participation are discussed.
The authors are grateful for the support of the Knight Foundation of New York and Murrow College Founding Dean Lawrence Pintak.
The multiplicity of national-level sources of news, such as cable news channels and the Web sites and social media sites of national news organizations creates the impression of an abundance of news. The reality is that locally relevant news coverage, particularly in small, rural communities, has diminished, even as national-level sources have expanded (Waldman, 2011, July, p. 5). Crucial links among news media, citizen participation, and community cohesion are threatened by a diminished local news presence (Yamamoto, 2011; Yamamoto & Ran, 2013).
This study assesses local news from the perspectives and behaviors of residents of Washington state. Specifically, the study compares rural and non-rural residents of Washington state in their assessment of the difficulty in accessing local and non-local news from a variety of media. In order to provide a context, Washington responses were compared with those from a representative national-level survey fielded one year earlier by the Pew Center (Pew Internet and American Life, 2011, January 1).
Previous research suggests that rural areas were disproportionately affected by the elimination of regional correspondents and the long-term trend of a pullback of the non-metro circulation of metropolitan dailies (Donohue, Tichenor, & Olien, 1986). Those trends were exacerbated by continued media consolidation, broadcast deregulation, economic pressures including the 2008 recession, and challenges to the news industry posed by free online content and classified advertising (Waldman, 2011, July).
BACKGROUND: CHANGING LOCAL NEWS ENVIRONMENT
The most ubiquitous sources of local news are television stations, community newspapers, and local radio stations. Local television is the source of local news for the majority of Americans (Pew Research Center, 2014a, p. 6). Increasingly, few television stations are producing their own local newscasts in the wake of a flurry of station consolidation and cost-cutting (p. 7). Both newspapers and radio stations have reduced news staffs over the past 30 years in response to declining revenues and audiences (Waldman, 2011, July, pp. 62-66). American citizens have noticed the decline in local news, and nearly one in three have turned away from a media outlet because it no longer provides the news they expect (Enda & Mitchell, 2013).
Newspaper revenues in 2012 were less than half of 2007 levels (Edmonds, et al., 2013, March 8). The recession of 2008 affected big city dailies more than small town weeklies; however, the impact on regional communities was felt as big city dailies closed regional bureaus (Cross, Bissett, & Arrowsmith, 2011 July). Regional daily newspapers have increasingly limited coverage of neighboring towns and cities (Waldman, 2011, July, p. 46).
Local radio news has declined since the deregulatory era of the 1980s, which conflated public interest with marketplace viability (Benton Foundation, 1999, May 3). Commercial radio news is limited to top-of-the-hour newscasts; news/talk/personality stations are more talk than news and feature almost exclusively nationally syndicated programming (Santhanam, Mitchell, & Olmstead, 2013, March 8). The median full-time radio news staff size for all markets in 2012 was 1 employee (Papper, 2012, November 13).
Local television stations, the preferred source of news cited by U.S. adults (Edmonds, et al., 2012), have turned their news departments into profit centers. Television news departments produced nearly half of all station revenues in 2012 and nearly 60% of news departments turned a profit (Papper, 2012, November 13). About 45% of stations added newscasts from 2011 to 2012, primarily in the early morning hours, to capture additional revenue. A record 5.5 hours of news aired on local stations in 2012, almost an hour more than in 2008 (Papper, 2012, November 13). In spite of these adjustments, local TV revenues, when adjusted for inflation, were at a 15-year low (Edmonds, et al., 2012). While employment levels have nearly rebounded to the peak reached in 2000 (Papper, 2012, November 13), many veteran reporters have been replaced by entry-level novices resulting in fewer investigative reports and less consistent coverage of local public affairs (Schwanbeck & Schwanbeck, 2011, April 22).
Considering the issues in local news discussed above, the main research questions raised in this study are:
RQ1: Do rural and non-rural Washington residents differ in their perception of the difficulty in accessing local news now versus five years ago?
RQ2: Do rural and non-rural Washington residents differ in the frequency by which they access local and non-local news from a variety of news media, and are these different in Washington state from those at the national level?
RQ3: Are rural and non-rural residents of Washington State different in terms of political knowledge and civic participation, and is there a relationship between frequency of local news access and political knowledge?
METHODS
To answer these questions, the researchers fielded a survey of Washington state adults from March 21 to April 27, 2012. This study includes an analysis of the findings from that survey. For comparison, this study also includes analyses of specific items that were repeated in a national survey fielded by the Pew Center for the People and the Press in January, 2011 (Pew Internet and American Life, 2011, January).
The Washington State adult sample included 995 adults age 18+ invited by Qualtrics and its online sample providers to participate in the survey to earn points that could be exchanged for rewards, such as money or items. The sample included an over-sample of 200 rural respondents to allow for sufficient statistical power for comparisons with non-rural residents. Nearly 3,000 participants began the survey. Respondents were disqualified for: not completing the survey; taking too long or not enough time to complete specific items; or for not meeting demographic targets such as age, Washington residence, or sex. The completion rate was 33.4%.
Panel members were randomly sampled from quota groups to produce a final sample that was comparable to the 2010 Washington State census parameters for age, sex, and race. Appendix Table 1 shows the Washington sample was slightly lower in the youngest age category, with 9.8% in the 18-24 age group versus 12.6% in the 2010 U.S. Census, and slightly higher in the Washington 50-64 and 65+ age categories than in the 2010 U.S. Census. The Washington sample was comparable to the Census parameters for sex. For racial categories, the Washington sample had a higher percentage of Whites (82.6 vs. 77.3%) than the 2010 U.S. Census, and a significantly lower percentage of Hispanics (3.9 in Washington versus 11.2 for the 2010 U.S. Census).
Due to the large increase in reliance of cellular phones and the Internet as primary communication outlets, especially for young people, random digit dialing is no longer a feasible method to reach a probability sample (Schaffner, 2011). There is ongoing debate in the survey science community about how to best resolve recent challenges to gathering representative samples. Matched quota opt-in Internet panels provide an alternative sampling method to reach members from a population. Some validating survey research has found little to no difference in terms of response quality when comparing opt-in quota samples to traditional probability sampling techniques (Sanders, Clark, & Stewart, 2007; Ansolabehere & Schaffner, 2014). Others have found higher levels of error in this comparison (i.e. Chang & Krosnick, 2009; Yeager Krosnick, Chang, Javitz, Levendusky, Simpser, & Wang, 2011).
FINDINGS
RQ1: Evaluation and uses of traditional, Web-based, and mobile media sources of local, state and national news.
The question of whether rural and non-rural respondents perceived a difference in the local news environment (“today compared to five years ago”) was first raised by the Pew Internet and American Life (2011, January 1) U.S. survey, and again in the 2012 Washington state survey.[1] Figure 1 below shows that the difference between rural and non-rural Washington residents’ perceived difficulty in keeping up with local news today compared with 5 years ago was statistically significant, with non-rural residents finding it easier to keep up with news about local communities than rural residents.[2] Overall, Washington adults’ responses were statistically closer to the “easier” pole than respondents in the sample of U.S. adults (see Appendix Table 2).
FIGURE 1. DIFFICULTY KEEPING UP WITH LOCAL NEWS TODAY COMPARED WITH 5 YEARS AGO.
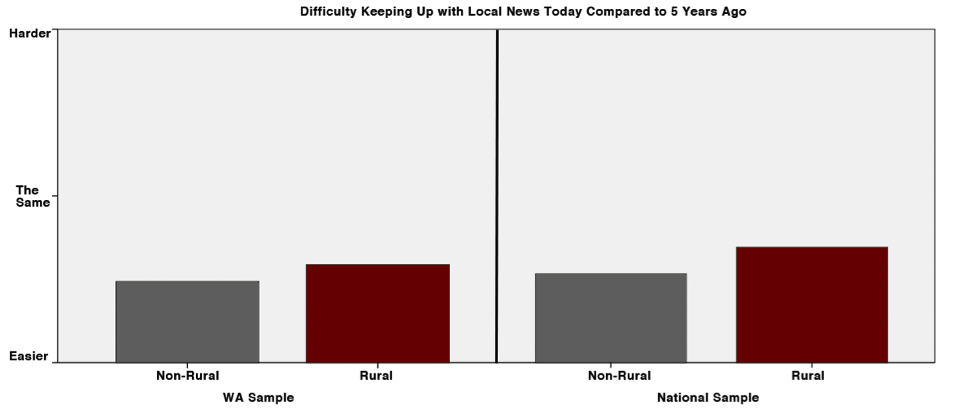
These results require a somewhat nuanced interpretation. Overall, respondents considered it between “easier” and “the same” as five years ago in keeping up with information and news about one’s local community. This would seem to indicate that respondents do not perceive a problem with the availability of local news and information. However, the systematic tendency of non-rural residents to score closer to the “easier” category than rural residents of both Washington and the United States suggests there are significant geographic-based differences that require further analysis.
The majority of the following results demonstrate that the disparity between rural and non-rural residents persists regarding the frequency of obtaining local news from traditional and new media. These differences disappear, for the most part, in measures of frequency with which they access state and national news media.
RQ2: Differences between rural and non-rural Washington residents in accessing local and non-local news from a variety of news media and between Washington state residents and U.S. adults in general.
Newspapers
As shown in Figure 2, rural and non-rural Washington residents report nearly the same frequency with which they obtain local news from the print version of a local newspaper. Table 3 shows the statistical tests associated with Figure 2.
FIGURE 2. FREQUENCY OF OBTAINING LOCAL NEWS FROM THE PRINT VERSION OF LOCAL NEWSPAPER
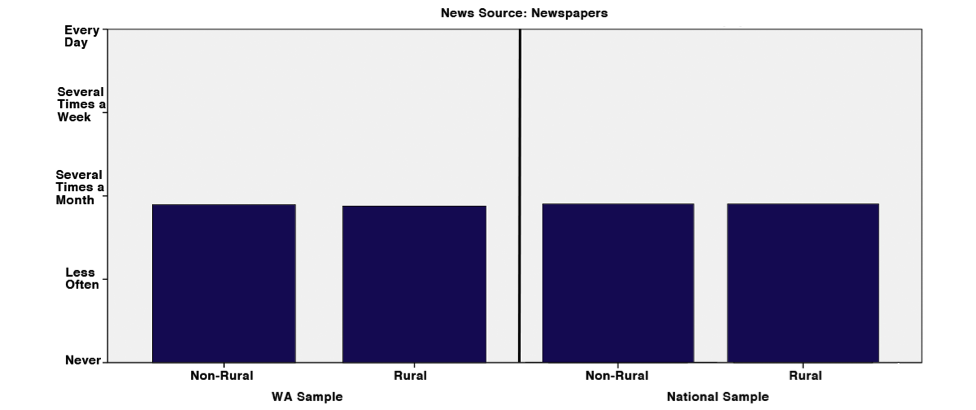
For all respondents, the average frequency of using a local newspaper is “several times a month.” This is a reasonable response for rural residents who rely on weekly newspapers. However, for non-rural respondents with access to a daily newspaper, “several times a month” is quite low, perhaps reflecting the declining circulation of daily newspapers (Newspaper Association of America, 2012, September 4).
The advent of newspaper Web sites is often posed as a geography-bridging technology to erase the rural penalty in access to local news (Hindman, Ernst, & Richardson, 2001). The results in Table 4 show that citizens across the nation report accessing the Web site or mobile site of a local newspaper almost as frequently as they access the print version: several times a month. The pattern of differences between rural and urban residents, both in Washington and the United States, also appears in Table 4. This shows that rural residents in Washington and the United States make less frequent use of the Web site of a local newspaper for local news than do non-rural residents. In general, however, Washington residents make significantly more frequent use of local newspaper Web sites than do U.S. adults.
Television
Television is the most frequently cited means by which U.S. adults obtain news “yesterday” (Santhanam, Mitchell, & Olmstead, 2013, March 8). The results from the Washington survey consistent with that finding; the average frequency of obtaining information about one’s local community from local television news broadcasts was closer to “several times a week” versus “several times a month” for local newspapers. Figure 3 reflects the tendency of local news broadcasts to focus on metropolitan communities. Rural residents from Washington were significantly less frequent users of television for local news than were non-rural residents.
FIGURE 3. FREQUENCY OF OBTAINING LOCAL NEWS FROM A LOCAL TELEVISION NEWS BROADCAST
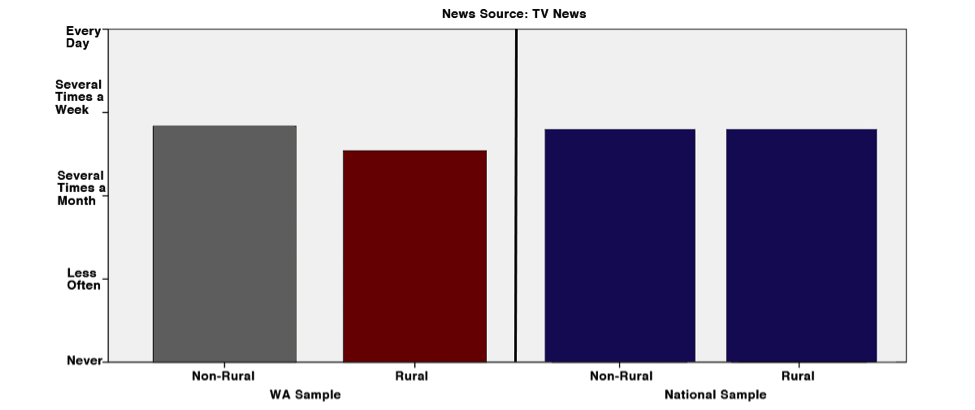
When comparing Washington residents with U.S. adults, Table 5 indicates that Washington residents were significantly less frequent users of local television news than were U.S. adults, and Washington rural residents were significantly less frequent local television users for local news than any other group. The likely explanation is the concentration of local television stations in four main metropolitan markets in Washington: Seattle-Tacoma, Spokane-Coeur d’Alene, Yakima, and Tri-Cities (Pasco, Kennewick, Richland), along with the domination of southwestern Washington by stations based in Portland, OR, which leaves many non-metropolitan communities underserved.
Television Web sites do not necessarily result in more local coverage for rural audiences. Reflecting this lack of local relevance, Table 6 shows that rural and non-rural disparities persist across the state and nation, and that rural Washington residents used local television news Web sites less frequently than any other group in the study.
Radio
A mainstay of local news reporting in all communities has been local radio stations. Rural Washington residents were no different from non-rural residents in their use of local radio. However, Table 7 shows that Washington residents were less frequent users of local radio as a source of local news than were U.S. adults in general. Respondents reported accessing local news from radio “several times a month,” which is about the same rate at which they read local newspapers. This seems low for a medium that has the potential for up-to-the minute coverage of local news, but given the decline in local radio news programming since the 1980s, the results are not surprising (Waldman, 2011, July).
Table 8 indicates that overall, rural residents were less frequent users of radio Web sites than were non-rural residents. Washington residents, in general, reported less frequent use of radio Web sites than adults across the nation. The frequency across the board was very low: between “less frequently (than several times a month)” and “never.” This indicates that local radio stations are either not attracting much attention to their local news coverage on their Web sites, or, more likely, they are simply not including enough local news on their Web sites to attract online visitors.
The emerging pattern is that rural residents are, in effect, voting with their feet by walking away from local television and radio to a greater extent than their urban counterparts. The effect holds, and in some cases is amplified, for Web-based versions of the local media. In spite of apparently small differences in magnitude, the pattern is persistent. The following findings for emerging sources of local news reinforce the pattern established above.
Interpersonal Discussion
Common-sense explanations for the lack of rural citizen reliance on local sources of news suggest that rural residents obtain the majority of news via interpersonal discussion and gossip. This assumes, however, that all individuals are connected with the frequently small and insular power structures of rural communities (Hindman, 1996; Hindman, et. al, 1999). Instead, decisions affecting local citizens are often made in closed-door sessions before being publicly announced. This process preserves the outward appearance of consensus, while limiting public participation in community decision-making (Hindman, 1996; Tichenor, Donohue & Olien, 1970).
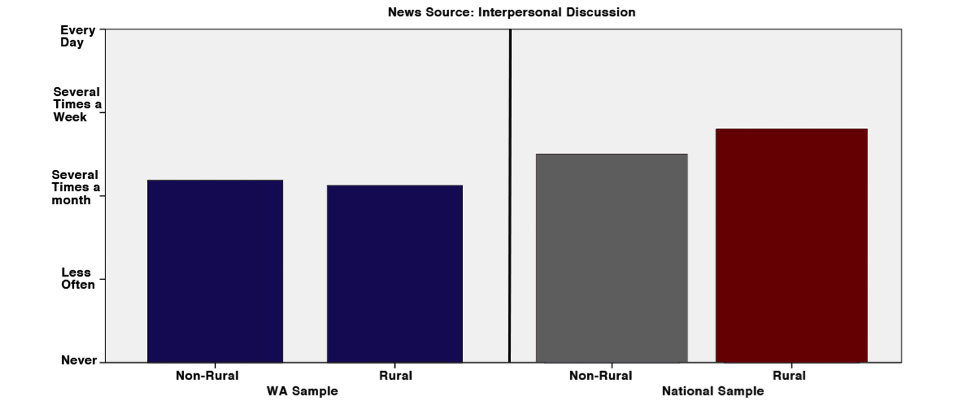
The results from the national sample of respondents, shown on the right side of Figure 4, is consistent with the notion that rural areas foster more interpersonal interaction than non-rural areas; rural residents are more frequent users of interpersonal communication as a news source about their local communities than non-rural residents. However, the left side of Figure 4 also shows there were no significant differences among Washington residents regarding local news via interpersonal discussion. Statistical analysis (Table 9) shows that the respondents represented in the national sample had significantly higher frequency of interpersonal discussion of news about their communities than did the individuals in the Washington sample.
FIGURE 4. FREQUENCY OF OBTAINING LOCAL NEWS FROM WORD OF MOUTH FROM FRIENDS, FAMILY, CO-WORKERS AND NEIGHBORS
Digital Media
One might expect that place-bound residents who are underserved by traditional media would compensate via access to new media news sources, such as locally relevant blogs, social network sites, and news aggregators such as Topix.com. However, new sources of information for local news were not being accessed as frequently as traditional media. In spite of the low frequency of use, significant differences emerged. Figure 5 shows that rural residents both in Washington and in the nation as a whole were less frequent users of blogs for local news than were non-rural residents.
FIGURE 5. FREQUENCY OF OBTAINING LOCAL AND NATIONAL NEWS FROM A BLOG ABOUT THE LOCAL COMMUNITY
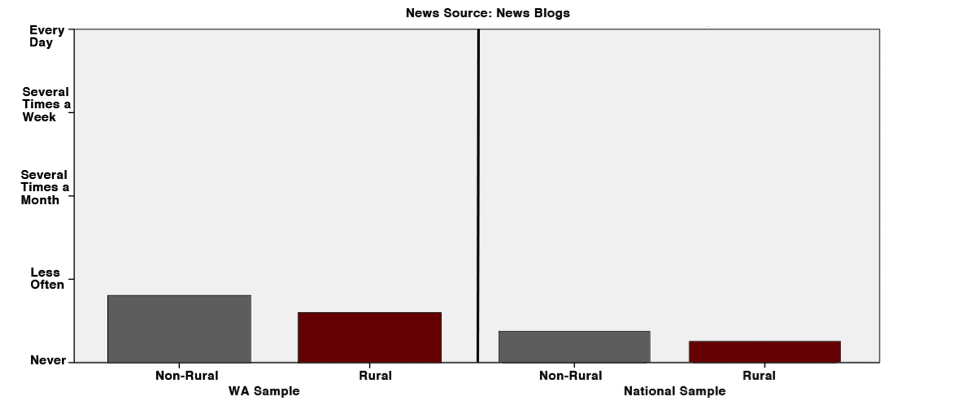
Table 10 indicates that Washington residents overall were more frequent users of blogs for local news than were U.S. residents. This is one indicator that Washington residents are at least equally capable and willing to access local information from non-traditional sources as are their national counterparts. Interestingly, there were no significant differences between rural and non-rural citizens on the rate at which they accessed national news from social Web sites. Both means were slightly lower than the “less often” frequency category. The mean score for the non-rural respondents (M = 0.8, SD =1.1) was not significantly different from the mean score for the rural respondents (M =0.7, SD= 1.2; F (1, 981) = 1.5, p = 0.2).
Repeating the pattern of rural Washington residents accessing locally relevant news less frequently from both traditional and new media than non-rural Washington residents, Figure 6 shows that rural Washington residents were less frequent users of online news portals such as Google News or Yahoo! News for local news.
FIGURE 6. FREQUENCY OF OBTAINING LOCAL AND NATIONAL NEWS FROM A NEWS PORTAL FOR NEWS ABOUT YOUR LOCAL COMMUNITY
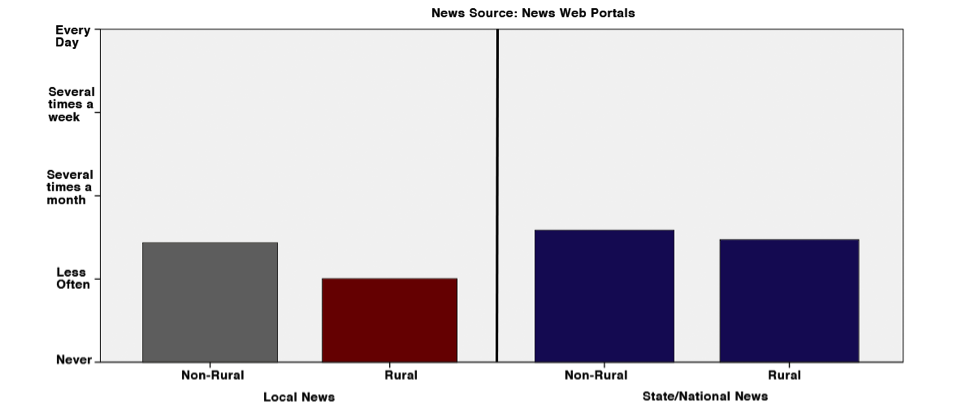
A different pattern emerges in the above figure regarding the frequency of accessing information and news about state and national topics. The pattern is that non-rural and rural differences disappear when it comes to accessing state and national news. The mean frequency for non-rural residents’ access of local news via Web portals was between “several times a month” and “less often” (M=1.4, SD 1.4) which is significantly greater than that of rural residents (M=1.0, SD 1.3; F (1, 981) = 18.9, p <.001). The mean frequency for both non-rural and rural residents’ access of state/national news via Web portals was not significantly different (non-rural M = 1.6, SD 1.4; rural M = 1.5, SD = 1.5; F (1, 982) = 1.2, p = 0.2). This supports the idea that the lower frequency by which rural residents access local news is less the result of a lack of skill or Internet access, and more the result of a lack of availability of local news.
The disparity between rural and non-rural resident frequency of accessing local information is repeated in an analysis shown in Table 11. Rural residents overall made less frequent use of Web search engines for local news than did non-rural residents across both samples. In spite of being in the state that is headquarters to Microsoft, creator of Internet Explorer and Bing, Washington residents used search engines less than adults throughout the country, and Washington rural residents were significantly less frequent users of Web search engines for local news than any other group. This was in spite of the fact that there were no significant differences between rural and non-rural Washington residents in accessing the Internet (non-rural M = 2.8, SD 0.5, rural M=2.9, SD .04, F(1,984) = 0.93, p > .05), in reading the news on the Internet (non-rural M = 2.9, SD 1.0, rural M = 2.9, SD = 1.1, F(1, 981 = .93, p > .05), and in owning a cell phone (non-rural M = 0.9, SD = 0.3, rural M = 0.9, SD = 0.3, F (1, 991) = .08, p > .05).
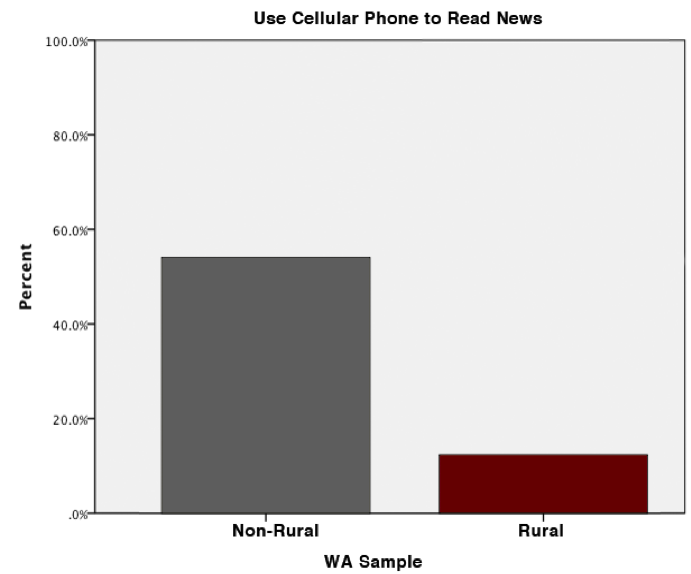
With cell phones becoming more ubiquitous than personal computers, one might expect that cell phones would become a technology that bridges the rural—non-rural divide. This does not appear to be the case, however, in Washington. A significantly larger proportion of non-rural Washington residents reported using their cell phones to access the Internet than rural residents (47% non-rural vs. 25% rural, F (1, 991) = 39.3, p < .001). These findings are consistent with the lack of access to high-speed mobile service in rural areas of the state (Washington State Broadband Office, 2013, January, p. 37).
As shown in Figure 7, the problem of a lack of access to high-speed mobile service in rural areas is exacerbating disparities in the way rural residents use mobile technologies. By a wide margin, rural Washington residents were less frequent users of cell phones to read online news than were non-rural audiences (“How often, if ever, do you use your cell phone to read online news?”). This is similar to national-level findings to a dichotomously-worded question, “Do you ever use your cell phone or tablet computer to go online for news or information about your community,” which showed 40% of rural residents versus 46% of non-rural residents answering “yes.”
These findings point to the lack of affordable mobile access in rural areas (Washington State Broadband Office, 2014, January 14, p. 12). The findings are also consistent with previous research documenting a lack of local news information created by journalists. However, a comparison of Internet skill (Hargittai & Hsieh, 2012) shows no difference between rural and non-rural participants. Combined with our findings from above, we conclude the lack of availability of local news in rural areas is the primary explanation for those residents’ less frequent use of a variety of media, both new and traditional, to access local news.
FIGURE 7. USE OF CELLULAR PHONE TO READ THE NEWS
RQ3: Washington State adults’ political knowledge and social participation, with comparisons between rural and non-rural residents
The implication of a rural penalty in access to information and to broadband resources is a decline in social participation, and ultimately, a lack of social cohesion within rural areas (Yamamoto, 2012).
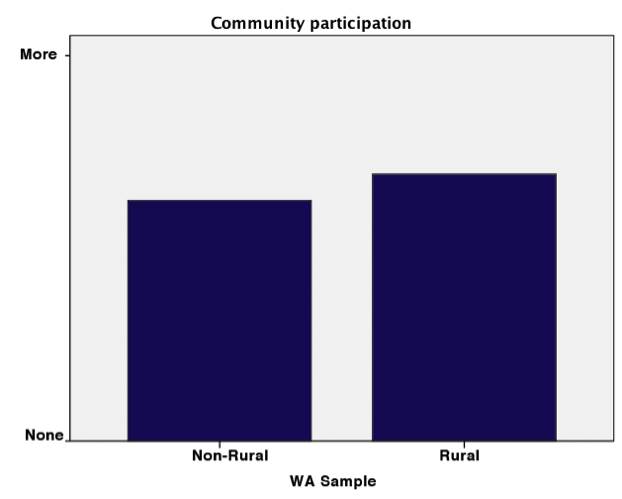
Surprisingly, in Washington State, there were no significant differences between rural and non-rural residents on a wide range of indicators of social participation including membership in religious or spiritual communities, adult sports leagues, youth organizations such as sports leagues, parents’ association like PTA, veterans’ groups, labor unions, service clubs, etc.
The findings shown in Figure 8 were surprising in that national trends consistently show significantly more social participation among rural than non-rural residents (Hindman & Yamamoto, 2011). In this case, a lack of significant differences may point to a decline in social participation among rural residents.
FIGURE 8. COMMUNITY PARTICIPATION BY RESIDENCE
A covariate with social participation, however, is knowledge of civic and public affairs. Informed citizens are more likely to participate in the life of their community, and vice-versa.
One of the concerns regarding a lack of local news in rural areas is that those residents would be disproportionately uninformed about national and local public affairs. However, rural and non-rural residents of Washington were not significantly different in levels of political knowledge on a number of measures of national-level public affairs topics: knowledge of the components in the Affordable Care Act (scale is 0-4, non-rural M = 2.6, SD 1.1, rural M = 2.6, SD =1.1, F (1, 991)= 0.2 p > .5), that the U.S. Supreme Court is charged with determining whether a law is constitutional or not (non-rural = 78% correct, SD = 0.4, rural = 84%, SD = 0.4, F (1, 999) = 0.5, p = 0.07), which party is more conservative at the national level (non-rural = 80% correct, SD = 0.4, rural =78%, SD = 0.42, F (1,991) = 0.5, p > .05), the political party that is in control of the U.S. House of Representatives (non-rural = 50% correct, SD = 0.5, rural = 55%, SD = 0.5, F (1, 991) = 1.9, p = 0.2, the size of the majority required to override a presidential veto (non-rural = 41 % correct, SD = 0.5, rural = 41%, SD = 0.5, F (1, 991) = 0, p > .05), and the title of the job held by Joseph Biden (non-rural = 80% correct, SD = 0.4, rural = 80%, SD = 0.4, F (1,991) = 0.01, p > .05).
These findings support the observation that residents are not lacking in ability or interest in news. The proliferation of nationally-oriented news has resulted in rural and non-rural citizens having equivalent levels of national political knowledge. Rural and non-rural Washington residents held similar levels of locally-relevant knowledge including the names of their state’s representatives to the U.S. Senate, their congressional district’s representative to the U.S. House, and the names of their mayor and school superintendent (not shown).
None of these findings should be taken to minimize the importance of local news. As shown in Table 12, locally-relevant knowledge was significantly predicted by the frequency of exposure to local news sources, even when controlling for demographic variables and place of residence.
These findings highlight the importance of local news in produced informed citizens, regardless of their place of residence; those who attend to local media the most have higher levels of locally-relevant knowledge.
CONCLUSION
In summary, the following findings emerged from the study:
- Both non-rural and rural residents find it easier today than five years ago to keep up with local news, but non-rural residents find it significantly easier than their rural counterparts.
- Rural residents were less frequent users of news media, both traditional and digital, for local news than non-rural residents.
- Rural participants were seeking broadcast and online news sources as often as urbanites for state and national news.
- Although there were no significant differences between rural and non-rural Washington residents in accessing the Internet, in reading the news on the Internet, in new media skills or in cell phone ownership:
- Rural residents were less frequent users of local breaking news than were their non-rural counterparts.
- Rural Washington residents used search engines less frequently than rural adults throughout the country, and Washington residents made less frequent use of Web search engines for local news than adults nationwide.
- Significant numbers of rural Washington residents were not using cellular phones for news or for connecting with the Internet compared with urban residents.
This study has shown that rural residents in general, sought news about their local communities from local media less frequently than their non-rural counterparts. In 4 out of 9 measures of frequency of access to local news sources, rural Washington residents were significantly lower than non-rural residents, and in 7 out of 9 measures, rural residents were nominally lower in frequency than non-rural residents. The Washington state evidence is consistent with national-level data showing a decline in local news reporting (Waldman, 2011, July); rural residents may be seeking local news less frequently simply because local news is not available. This study also has shown that individuals who pay greater attention to local news tend to have greater knowledge of local political affairs. Together, these findings set the stage for the emergence of rural vs. non-rural disparities in locally-relevant knowledge. This potential disparity, should it occur, would not be the result of a lack of interest or a lack of skill on the part of rural residents, but instead, the result of a lack of local news in rural areas.
What might be the implications of these findings for community journalism? First, the data on declining sizes of newspaper and television newsrooms (Waldman, 2011, July, pp. 62-66), the reduction in the number of radio and television stations producing independent local news (Pew Research Center, 2014a, p. 7), and the replacement of veteran reporters with entry-level hires (Schwanbeck & Schwanbeck, 2011, September 22) all point to less availability of local news. The perception among respondents to this study that it is easier to access what is available from local media now versus 5 years ago may not be about the quantity or quality of local news but instead be about the convenience offered by digital versions of local news.
The more troubling statistic from a recent national study was that one in three citizens have left a media outlet source because it no longer provided the information that they expected (Enda & Mitchell, 2013). This raises the question, what can community journalists provide that local news aggregators such as Topix.com cannot? It is a question of journalistic values and roles, not about audience interests, The assumption is that if local journalism is proving its value to the community, then its audiences will remain.
Insight into what value journalism provides its communities comes from journalists themselves. The latest report in The American Journalist surveys (Wilnat & Weaver, 2014) shows that 78% of respondents said “investigating government claims” was extremely important (p. 12). This “watchdog” role was at an all-time high since the surveys began in 1971. It is interesting to note that journalists, who are acutely aware of the pressures facing their profession, have identified the traditional watchdog role as most important. Perhaps it is because they understand that local news organizations are uniquely equipped to publicize the missteps of governmental officials.
Research placing the content and roles of editors into the context of the community’s size and complexity would suggest that news organizations serving small communities tend to have scant coverage of the types of local, inter-governmental conflicts that are typical of metropolitan communities (Olien, et al., 1968). This is not because of censorship on the part of the local news organization, but instead the result of the unwillingness of public officials in small communities to go on record criticizing other city leaders. Newspapers serving smaller communities would provide extensive coverage of disputes which pit local officials against non-local agencies (Hindman, 1996). This is because the external source of conflict is less threatening to the internal cohesion of a small community.
Community journalists can perform the watchdog role with the help of open records and meetings laws and independent investigative agencies within government such as state auditors and attorneys general (Schudson, 2008). Local news organizations, particularly those organizations facing staffing cuts, are generally not equipped to perform independent investigations of local governments. Journalists are, however, capable of writing interesting and important stories based on official investigations, particularly those which document mistakes by local officials or violations of the public trust. A majority (68.8%) of journalists in the Wilnat and Weaver (2014) survey also consider “analyzing complex problems” to be an extremely important role. In the absence of community journalism, a state auditor’s report critical of local government might go unnoticed.
Citizens depend on community journalists to inform citizens, not about every action of local government, but about those inevitable occasions when mistakes occur and when changes must take place (Schudson, 2008). Without reporting of the nature of the mistakes and the steps being taken to correct the resulting problems, citizens are left uninformed and unable to vote wisely. The absence of local news organizations in a community beset with official misconduct turns a drought of local news into a failure of local democracy.
A limitation of this study was the lack of measurement of actual news content. Future studies should compare news coverage of local and surrounding communities in order to supplement resident self-reports of their frequency of obtaining news about local communities from various sources. Another limitation of this study was a significant under-representation of Hispanic/Latino respondents. The 2010 U.S. Census reported that 11% of the Washington population self-identified as Hispanic. The sample for this study was just under 4% Hispanic. Future samples of adult residents of Washington must include over-samples of Hispanics in order to analyze the use of local news by this growing and under-represented segment of the population. Future studies should replicate the measures in this study in order to detect changes in frequency of access a perceived ease of access to local news. The second wave of surveys would also allow for an analysis of changes in public affairs knowledge and community participation.
[1] For this analysis, “rural” is defined as the response to the question, “Which of the following BEST describes the place where you now live?” Those who chose “A rural area” (n=244) were categorized as “rural” and those who chose “A large city,” “A suburb near a large city,” or “A small city or town” (n=749) were categorized as “non-rural.” This measure likely underestimates the number of respondents who live in non-urban areas which is defined as towns with fewer than 2500 residents.
[2] When the text refers to a comparison as showing “differences” between groups, those refer to statistically significant differences. Visually, statistically significant differences are shown by bars with different colors (grey and red) whereas differences that did not reach significant levels are portrayed by bars with the same color (blue). Given the large sample sizes in the WASHINGTON (N: 995) and U.S. (N: 2250), even differences that may appear small in magnitude may be statistically significant. We reserve the term “no difference” to those that do not reach statistical significance. Please refer to the Appendix tables for statistical results corresponding to each figure.
WORKS CITED
- Ansolabehere, S. & Schaffner, B. (2014, May 28). Does survey mode still matter? Political Analysis. Advanced access available: http://pan.oxfordjournals.org/content/early/2014/05/28/pan.mpt025.full.p…doi:10.1093/pan/mpt025
- Benkler, Y. (2006). The wealth of networks: How social production transforms markets and freedom. New Haven: Yale University Press.
- Benton Foundation (1999, May 3). Charting the digital broadcasting future: Section 2, The Public Interest Obligations of Broadcasters. Advisory Committee on Public Interest Obligations of Digital Television Broadcasters. http://benton.org/initiatives/obligations/charting_the_digital_broadcasting_future/
- Chang, L. & Krosnick, J. A. (2009). National surveys via RDD telephone interviewing versus the Internet: Comparing sample representativeness and response quality. Public Opinion Quarterly, 73, 641-678.
- Cross, A., Bissett, B., & Arrowsmith, H. (2011). Circulation patterns of weekly newspapers in Central Appalachia and Kentucky. Grassroots Editor, 52(3), 4-8.
- Donohue, G.A., Tichenor, P.J., and Olien, C.N. (1986). Metro daily pullbacks and knowledge gaps within and between communities. Communication Research 13, 453-493.
- Dylko, I., Beam, M. A., Landreville, K. D., & Geidner, N. W. (2012). Filtering 2008 presidential election news on YouTube by elites and non-elites: An examination in the democratizing potential of the Internet. New Media & Society, 14(5), 823-849.
- Edmonds, R., Guskin, E., Rosenstiel, T. & Mitchell, A., and Jurkowitz, M. (2013, March 18). Newspapers: By the Numbers. The Pew Research Center’s Project for Excellence in Journalism: The state of the News media 2013. http://stateofthemedia.org/2013/newspapers-stabilizing-but-still-threatened/newspapers-by-the-numbers/
- Enda, J. & Mitchell, A. (2013, March 18). Many Americans abandon news outlets, citing less information. The Pew Research Center’s Project for Excellence in Journalism. The state of the news media 2013. http://stateofthemedia.org/2013/special-reports-landing-page/citing-reduced-quality-many-americans-abandon-news-outlets/
- Hargittai, E. & Hsieh, Y. P. (2012). Succinct survey measures of web-use skills. Social Science Computer Review, 30, 95-107.
- Hindman, D. (1996). Community newspapers, community structural pluralism, and local conflict with nonlocal groups. Journalism Quarterly, 73, 708-721.
- Hindman, D. (2000). The rural urban digital divide. Journalism and Mass Communication Quarterly, 77(3), 549-560.
- Hindman, D., Ernst, S., & Richardson, M. (2001). The rural-urban gap in community newspaper editors’ use of information technologies. Mass Communication & Society, 4(2), 149 164.
- Hindman, D., Littlefield, R., Preston, A., & Neumann, D. (1999). Structural pluralism, ethnic pluralism, and community newspapers. Journalism and Mass Communication Quarterly, 76(2), 250-263.
- Hindman, D. & Yamamoto, M. (2011). Social capital in a community context: A multilevel analysis of individual- and community-level predictors of social trust. Mass Communication & Society, 14, 838-856.
- Newspaper Association of America. (2012, September 4). Newspaper circulation volume. http://www.naa.org/Trends-and-Numbers/Circulation/Newspaper-Circulation-Volume.aspx
- Olien, C.N., Donohue, G. A., & Tichenor, P.J. (1968). Community editor’s power and the reporting of conflict. Journalism Quarterly, 47, 472‑78.
- Papper, R. (2012, November 13). 2012 TV and Radio News Staffing and Profitability Survey. Radio and Television Digital News Association. http://www.rtdna.org/article/2012_tv_and_radio_news_staffing_and_profitability_survey
- Pew Internet and American Life. (2011, January 1). January 2011: Local news. Retrieved from http://pewinternet.org/Shared-Content/Data-Sets/2011/January-2011–Local-News.aspx.
- Pew Research Center. (2014a). State of the news media: Overview. Retrieved from: http://www.journalism.org/2014/03/26/state-of-the-news-media-2014-overview/
- Pew Research Center. (2014b). Pew Research Journalism Project: Local broadcast TV advertising revenue. Retrieved from: http://www.journalism.org/media-indicators/local-broadcast-tv-advertisin…
- Sanders, D., Clarke, H. D., Stewart, M. C., Whiteley, P. (2007). Does mode matter for modeling political choice? Evidence from the 2005 British election study. Political Analysis, 15, 257-285.
- Santhanam, L., Mitchell, A., and Olmstead, K. (2013, March 18). Audio: Digital drives listener experience. The Pew Research Center’s Project for Excellence in Journalism. The state of the news media 2013. http://stateofthemedia.org/2013/audio-digital-drives-listener-experience/
- Schaffner, B. F. (2011). Polling: Innovations in survey research. In S. K. Medvic (Ed.), New directions in campaigns and elections (pp. 39-58). New York: Routledge.
- Schudson, M. (2010). Why democracies need an unlovable press. Malden, MA: Polity Press.
- Schwanbeck, B. & Schwanbeck, K. (2011, September 22). Running on empty: The brain drain in local TV news.
- . http://www.youtube.com/watch?v=nAFpGCKl3Mg
- Tichenor, P., Donohue, G., & Olien, C. (1970). Community conflict and the press. Beverly Hills: Sage.
- Waldman, S. (2011, July). The information needs of communities: The changing media landscape in a broadband age. Federal Communications Commission. http://www.fcc.gov/info-needs-communities
- Washington State Broadband Office. (2013, January). 2012 annual report on broadband in Washington. Available: http://www.commerce.wa.gov/Documents/Broadband-2012-Report-FINAL.pdf
- Wilnat, L. & Weaver, D. (2014). The American Journalist in the Digital Age: Key findings. Bloomington, IN: School of Journalism, Indiana University. Available: http://news.indiana.edu/releases/iu/2014/05/2013-american-journalist-key…
- Yamamoto, M. (2011). Mass media as a macro-level source of social control: A new direction in the structural model of mass media. Mass Communication & Society, 14, 820-837.
- Yamamoto, M. & Ran, W. (2013). Drug offenses in communities: Community newspapers as a macro-level source of social control. Journalism & Mass Communication Quarterly, 90(4), 629-651.
- Yeager, D. S., Krosnick, J. A., Chang, L., Javitz, H. S., Levendusky, M. S., Simpser, A., & Wang, R. (2011). Comparing the accuracy of RDD telephone surveys and Internet surveys conducted with probability and nonprobability samples. Public Opinion Quarterly, 75, 125-138.
APPENDIX
TABLE 1. WASHINGTON STATE SAMPLE VERSUS U.S. CENSUS PARAMETERS
| Category | WA in US Census+ | WA sample |
| 18-24 | 12.64 | 9.8 |
| 25-34 | 18.16 | 17 |
| 35-49 | 27.24 | 25.6 |
| 50-64 | 25.87 | 30.4 |
| 65+ | 16.09 | 17.2 |
| 100 | 100 | |
| Male | 49.8 | 49.2 |
| Female | 50.2 | 50.8 |
| White | 77.27 | 82.6 |
| Black | 3.57 | 3 |
| Asian | 7.15 | 5 |
| Hispanic | 11.24 | 3.9 |
| Other/mixed race | 4.8 | |
| Median Household Income* | $57,244 | $50 – $75K |
Sources: *U. S. Census Bureau, American Community Survey, 5-Year Estimates. Updated every year. http://factfinder2.census.gov; http://2010.census.gov/2010census/popmap/ipmtext.php?fl=53
TABLE 2. DIFFICULTY OF KEEPING UP WITH INFORMATION AND NEWS ABOUT YOUR LOCAL COMMUNITY TODAY COMPARED TO FIVE YEARS AGO, BY RESIDENCE AND SAMPLE
| Sample | ||
| WA | US | |
| Residence | M (SD) | M (SD) |
| Non-rural | 0.49 (0.69) | 0.53 (0.7) |
| Rural | 0.59 (0.69) | 0.69 (0.74) |
Note. Entries are mean scores ranging from 0 ‘easier’ 1 ‘the same’ 2 ‘harder’. Sample F (1, 9059) = 6.8**; Residence F (1, 9059) = 22.1***, Sample x Residence F(1, 9059) = 1.2.
TABLE 3. FREQUENCY OF OBTAINING INFORMATION ABOUT YOUR LOCAL COMMUNITY FROM THE PRINT VERSION OF A LOCAL NEWSPAPER
| Sample | ||
| WA | US | |
| Residence | M (SD) | M (SD) |
| Non-rural | 1.9 (1.4) | 1.9 (1.5) |
| Rural | 1.9 (1.4) | 1.9 (1.5) |
Note. Entries are mean scores ranging from 0 ‘never,’ 1 ‘less often,’ 2 ‘several times a month,’ 3 ‘several times a week,’ 4 ‘every day.’ Sample F(1, 7209) = .35; Residence F (1, 7209) = .21, Sample x Residence F(1, 7209) = .13.
TABLE 4. FREQUENCY OF OBTAINING INFORMATION ABOUT YOUR LOCAL COMMUNITY FROM THE WEB SITE OF A LOCAL NEWSPAPER PRINT VERSION OF A LOCAL NEWSPAPER
| Sample | ||
| WA | US | |
| Residence | M (SD) | M (SD) |
| Non-rural | 2.0 (1.4) | 1.4 (1.3) |
| Rural | 1.6 (1.9) | 1.3 (1.3) |
Note. Entries are mean scores ranging from 0 ‘never,’ 1 ‘less often,’ 2 ‘several times a month,’ 3 ‘several times a week,’ 4 ‘every day.’ Sample F(1, 7209) = 91.5***; Residence F (1, 7209) = 36.0***, Sample x Residence F(1, 7209) = .43
TABLE 5. FREQUENCY OF OBTAINING INFORMATION ABOUT YOUR LOCAL COMMUNITY FROM A LOCAL TELEVISION STATION
| Sample | ||
| WA | US | |
| Residence | M (SD) | M (SD) |
| Non-rural | 2.8 (1.3) | 2.8 (1.4) |
| Rural | 2.5 (1.5) | 2.8 (1.5) |
Note. Entries are mean scores ranging from 0 ‘never,’ 1 ‘less often,’ 2 ‘several times a month,’ 3 ‘several times a week,’ 4 ‘every day.’ Sample F(1, 7209) =3.9*; Residence F (1, 7209) = 7.3**, Sample x Residence F(1, 7209) = 6.1*
TABLE 6. FREQUENCY OF OBTAINING INFORMATION ABOUT YOUR LOCAL COMMUNITY FROM THE WEB SITE OF A LOCAL TELEVISION STATION
| Sample | ||
| WA | US | |
| Residence | M (SD) | M (SD) |
| Non-rural | 1.7 (1.3) | 1.4 (1.4) |
| Rural | 1.2 (1.2) | 1.3 (1.3) |
Note. Entries are mean scores ranging from 0 ‘never,’ 1 ‘less often,’ 2 ‘several times a month,’ 3 ‘several times a week,’ 4 ‘every day.’ Sample F(1, 7209) = 6.2*; Residence F (1, 7209) = 24.5***, Sample x Residence F(1, 7209) = 14.7***.
TABLE 7. FREQUENCY OF OBTAINING INFORMATION ABOUT YOUR LOCAL COMMUNITY FROM A LOCAL RADIO BROADCAST
| Sample | ||
| WA | US | |
| Residence | M (SD) | M (SD) |
| Non-rural | 1.9 (1.4) | 2.2 (1.6) |
| Rural | 1.9 (1.5) | 2.2 (1.6) |
Note. Entries are mean scores ranging from 0 ‘never,’ 1 ‘less often,’ 2 ‘several times a month,’ 3 ‘several times a week,’ 4 ‘every day.’ Sample F(1, 7209) = 18.9***; Residence F (1, 7209) = .16, Sample x Residence F(1, 7209) = .17
TABLE 8. FREQUENCY OF OBTAINING INFORMATION ABOUT YOUR LOCAL COMMUNITY FROM THE WEB SITE OF A LOCAL RADIO STATION
| Sample | ||
| WA | US | |
| Residence | M (SD) | M (SD) |
| Non-rural | 1.0 (1.2) | .72 (1.2) |
| Rural | .84 (1.1) | .62 (1.1) |
Note. Entries are mean scores ranging from 0 ‘never,’ 1 ‘less often,’ 2 ‘several times a month,’ 3 ‘several times a week,’ 4 ‘every day.’ Sample F(1, 7209) = 25.5***; Residence F (1, 7209) = 8.7**, Sample x Residence F(1, 7209) = .61
TABLE 9. FREQUENCY OF OBTAINING INFORMATION ABOUT YOUR LOCAL COMMUNITY FROM WORD OF MOUTH FROM FRIENDS, FAMILY, CO-WORKERS AND NEIGHBORS
| Sample | ||
| WA | US | |
| Residence | M (SD) | M (SD) |
| Non-rural | 2.2 (1.1) | 2.5 (1.2) |
| Rural | 2.1 (1.2) | 2.8 (1.1) |
Note. Entries are mean scores ranging from 0 ‘never,’ 1 ‘less often,’ 2 ‘several times a month,’ 3 ‘several times a week,’ 4 ‘every day.’ Sample F(1, 7209) = 105.5***; Residence F (1, 7209) = 3.8**, Sample x Residence F(1, 7209) = .61
TABLE 10. FREQUENCY OF OBTAINING INFORMATION ABOUT YOUR LOCAL COMMUNITY FROM A BLOG ABOUT YOUR LOCAL COMMUNITY
| Sample | ||
| WA | US | |
| Residence | M (SD) | M (SD) |
| Non-rural | .81 (1.1) | .37 (.86) |
| Rural | .59 (1.0) | .25 (.67) |
Note. Entries are mean scores ranging from 0 ‘never,’ 1 ‘less often,’ 2 ‘several times a month,’ 3 ‘several times a week,’ 4 ‘every day.’ Sample F(1, 7209) = 116.8******; Residence F (1, 7209) = 23.1***, Sample x Residence F(1, 7209) = 2.1**
TABLE 11. FREQUENCY OF OBTAINING INFORMATION ABOUT YOUR LOCAL COMMUNITY FROM AN INTERNET SEARCH ENGINE SUCH AS GOOGLE OR BING
| Sample | ||
| WA | US | |
| Residence | M (SD) | M (SD) |
| non-rural | 1.6 (1.2) | 2.3 (1.4) |
| rural | 1.1 (1.2) | 2.3 (1.5) |
Note. Entries are mean scores ranging from 0 ‘never,’ 1 ‘less often,’ 2 ‘several times a month,’ 3 ‘several times a week,’ 4 ‘every day.’ Sample F(1, 7209) = 3952***; Residence F (1, 7209) = 21.5***, Sample x Residence F(1, 7209) = 10.0*
TABLE 12. PREDICTING KNOWLEDGE OF LOCAL PUBLIC AFFAIRS BY FREQUENCY OF USING LOCAL NEWS
| B (SE) | β | ||
| (Constant) | -.085 (.292) |
||
| Age | .227 (.046) |
.166*** | |
| Sex (female) | -.067 (.104) |
-.020 | |
| Ethnicity (white) | .228 (.143) |
.051 | |
| Rural residence | -.047 (.123) |
-.012 | |
| Education | .212 (.039) |
.170*** | |
| Local news frequency | .241 (.074) |
.105** |
Note: Adjusted R2 = 6.5%, F (6, 964) = 12.3, p< .001.
*p<.05, ** p<.01, *** p<.001
About the Authors
Dr. Doug Blanks Hindman is an associate professor at the Edward R. Murrow College of Communication at Washington State University.
Dr. Michael Beam is an assistant professor at the Edward R. Murrow College of Communication at Washington State University.